
KO|EN
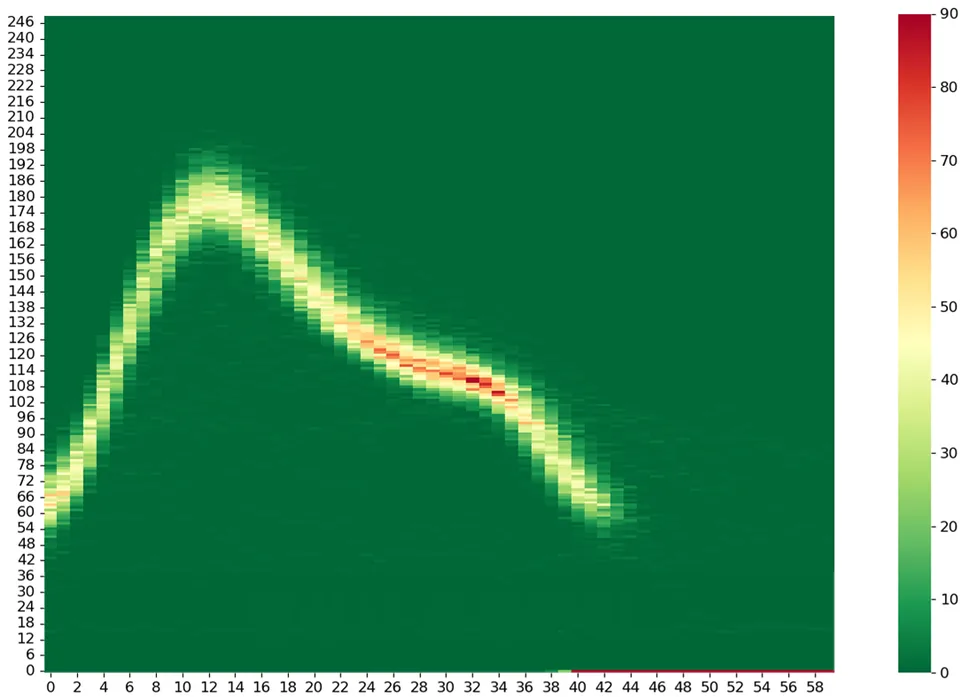
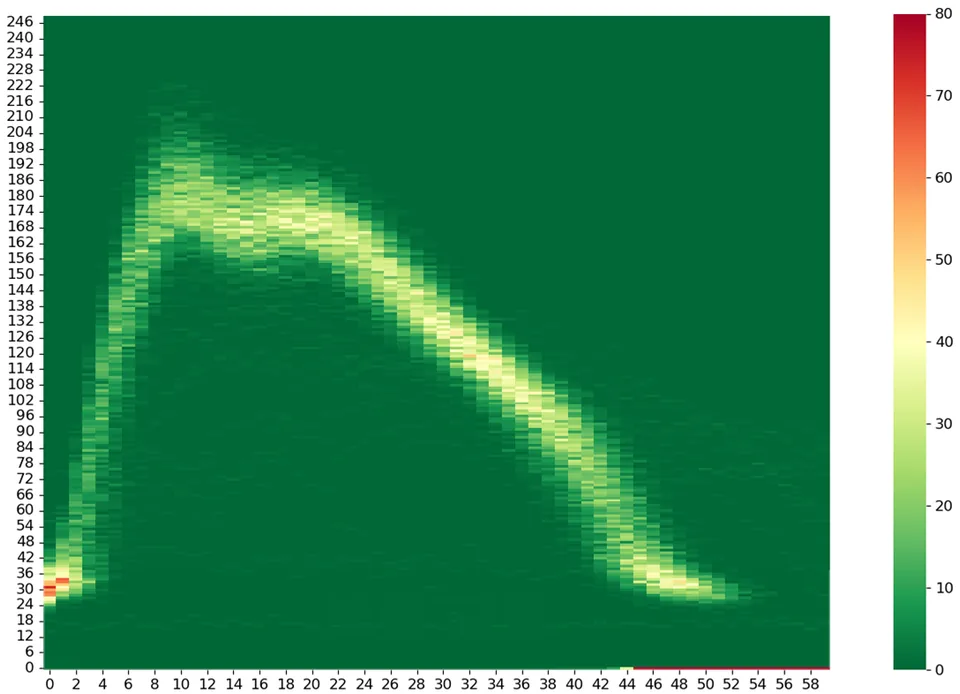
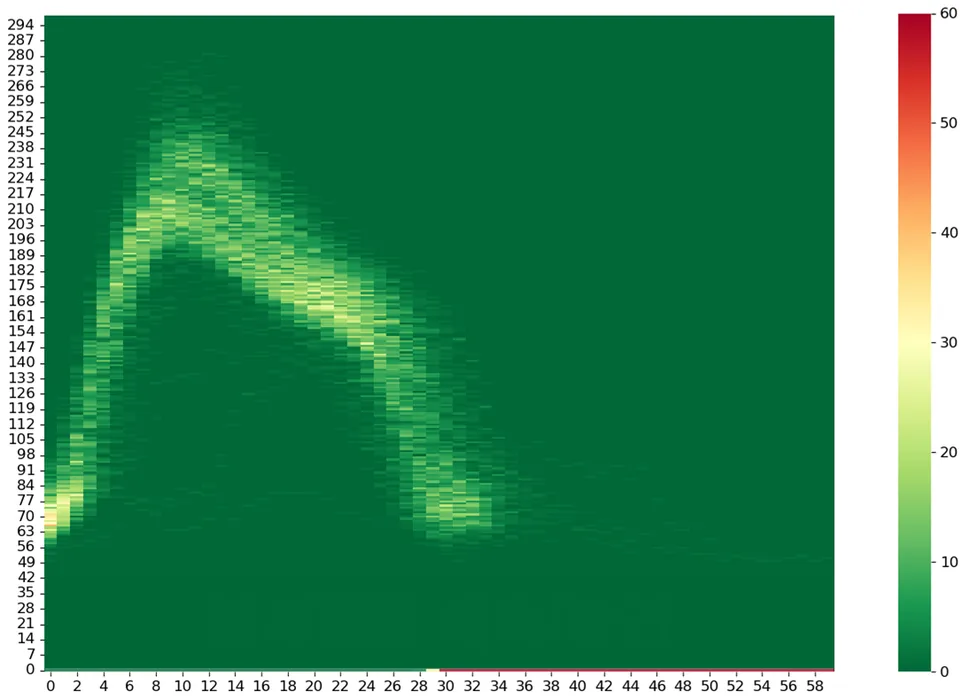
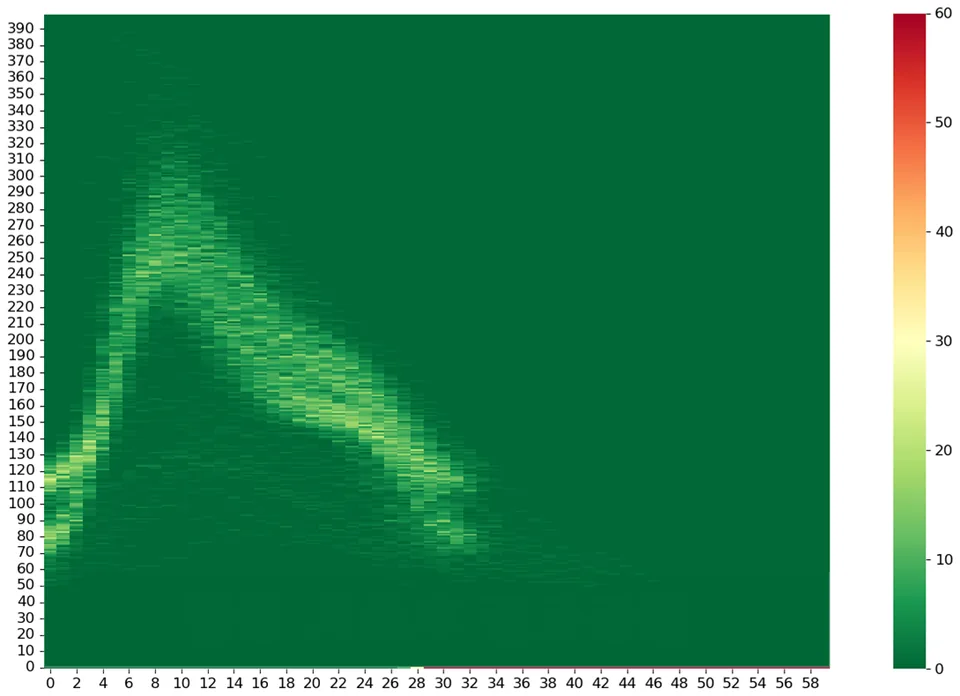
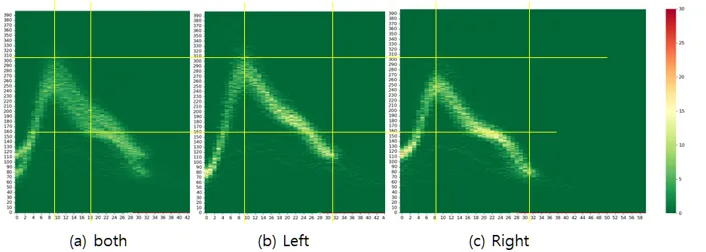
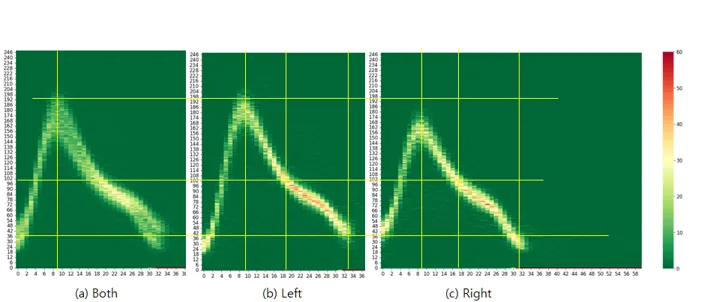
A gait heatmap is made by cutting 5 to 30 minutes of treadmill walking into individual steps and overlaying them, so the narrower and deeper the band, the more consistently you walk. The vertical axis is the load your walking places on the treadmill motor (electric current), and the horizontal axis is time, shown over a one-second window in units of one AC power cycle (1/60 s on 60 Hz power). Values vary somewhat from treadmill to treadmill. The redder a point, the more steps passed through it; wide, blurred areas are where your steps vary. Viewing the combined picture alongside separate left-foot and right-foot pictures lets you compare the two sides at a glance.
Below are examples drawn the same way from real walking records. Even on the same treadmill, each person's picture takes a clearly different shape. These pictures are for visually observing walking characteristics and do not indicate a diagnosis or treatment effect.
Every person walks differently
Splitting left and right
Both feet, the left foot, and the right foot are drawn separately, and yellow reference lines compare the height and timing of each side's peak.
If you couldn't find the answer you're looking for, submit a 1:1 inquiry and we'll respond within 3 business days.
Contact Us